Real Estate Taxation 101


The town of Wayland Massachusetts now has some bragging rights. We have one of the most frequent series of operational overrides in our state (5 in the past 7 years and we have never failed one in 20 years).
The operational overrides fund Wayland’s day-to-day expenses and our leaders have decided that it is easier to ‘go to the well’ of taxation rather than make sacrifices or bargain harder at the union negotiating table.
The result of this over taxation is as follows:
-
1.Many Wayland citizens are suffering even more because of the added burden of dealing with the world economic meltdown
-
2.Our town gets higher and higher tax rates, which influence potential real estate buyers
-
3.There is a resulting tendency for our real estate to disproportionally become devalued.
This is a history of Average and Median Wayland residential single family property values since FY2000
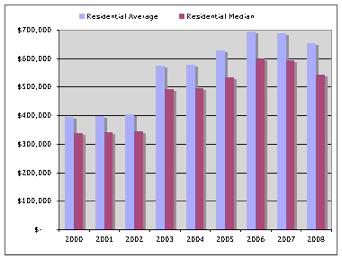
You can see the beginning of property devaluations as early as FY2007. It will be interesting to see what this data looks like in FY2009. Other communities have also suffered devaluations, but Wayland is different. A Boston Globe article (October 2008) a large, -20% relative drop in Median Sales price for Wayland when compared to 14 commonly referenced peer towns (source: Warren Group).
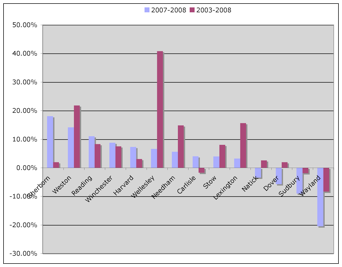
The chart below shows that Wayland had the worst real estate depreciation from 2007-2008. Sudbury in second place had only a -10% drop. And, over the 6 year period from 2003 to 2008 Wayland had the worst depreciation, -9%, with only 3 towns of the 14 showing a negative depreciation.
Some have argued that this Warren Group comparison is not valid or fair. The reasons given is that different price ranges of houses will sell in different quantities from town to town and from year to year, so an apples to apples comparison is not possible.
Perhaps the best argument against these statistics came from one individual: “The truth is that this statistic is not terribly meaningful since it compares sales in one year comprised of one set of homes v. sales in another comprised of a completely differently set of homes.”
Whether the Warren Group data is a valid comparison tool is yet to be determined. I am in the process of working with them to get more precision in the justification (or not) of using this data.
Perhaps an anecdotal story from a Wayland lawyer who has first hand knowledge of a lengthy and difficult selling process, that happened over the past year, would be a better way to judge what the true story is about Wayland property valuations in 2009 and going forward.
On February 2, 2009 the Finance Committee held a hearing on the state of the Wayland Budget and a well known citizen and lawyer came to the public commentary microphone to speak.
Here what he had to say:
ABOUT Proposition 2 1/2
Proposition 2½ limits the amount of revenue a city or town may raise from local property taxes each year to fund municipal operations. Communities must seek voter approval to raise additional funds beyond Proposition 2½ limits.
The original intent of proposition 2 1/2 was for occasional emergency funding and not intended as a routine tool to be used frequently to balance the operational budget. The law never restricted this however, and what we have in Wayland are frequent operational overrides.
Link to Mass Municipal Association on Proposition 2 1/2
operational vs. debt-exclusion overrides
Operational Overrides balance the recurring operational budget which is primarily composed of labor costs. These are PERMANENT increases in the tax levy of the real estate of the town.
Debt-Exclusion overrides are primarily used for capital borrowing and they are financed as municipal debt. Usually these are timed to replace old debt which is due to come off the books. These are TEMPORARY increases in the tax levy of the real estate of the town and last as long as the life of the loan.
Override types
The law allows for several types of overrides:
Single type overrides require all funding requests be LUMPED into a single YES or NO ballot question. Wayland has never deviated from this type of override. The majority of your recent leaders feel that lumping life and death services with non life and death services is justified. “If you want your ambulances then you go for the whole override.” This was said to me right at the Selectmen’s table. I believe this is a form of extortion.
Menu overrides provide choices so that the voter can decide how the town will spend their money and how much on different functions.
Pyramid overrides, slightly more complicated than the first two, provide lumped amounts in increasing amounts, where the largest amount wins. One of the choices is also zero dollars.
Again, Wayland’s leaders seem to love the Single, YES and NO override ballot question.
Click to see the Warren Group Mass % change in Median property values 2007-2008
Click to see the Warren Group report on Boston.com on Mass Housing price Gains and Losses 2007-2008
The Official Wayland Board Of Assessors Calculation of Property Tax Increases FY2000 to FY2007 Inclusive
All Tax Related Charts on the right were created using this official assessor data.
FY2008 has not been calculated to date so Alan Reiss has done this computation based on the most recent assessor data.
History of wayland residential tax bills
Some observations:
-
1. Both the Average and Median (50%) residential tax bill track in increase almost identically
-
2.What you see is an exponential growth curve which has been developing since FY2000. Each successive year the tax bill accelerates at a rate which is, for many, unsustainable.
-
3.In round figures, the FY2008 average tax bill is $10,500 and the median tax bill is $9,000
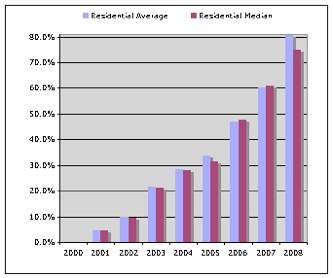
History of wayland residential tax bill Growth
In FY2008 there was a large divergence between Average and Median tax bills. This could be due to a sustained increase in larger and wealthier homes in Wayland over mid-sized and smaller homes.
The average tax bill has increased 80% since FY2000
The median tax bill has increased 75% since FY2000
Has your income done the same over the same period of time?
If not, then this is unsustainable for you.
Below is a history of Average and Median Wayland residential single family tax bills since FY2000
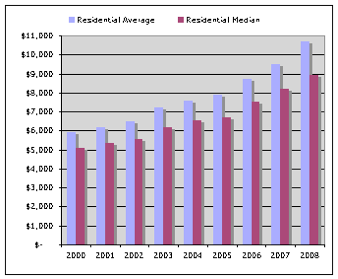
(FY2008 calculated by A. J. Reiss from Board of Assessor data)
Below is a history of Average and Median Wayland residential single family tax bill growth since FY2000